Short Answer
Start by naming the business outcome that changed, the date the shift began, the campaigns or channels in scope, and a fair comparison window. Then verify that the decline exists in mature data. Trace the funnel in order: delivery, response, conversion, and downstream business outcomes. Place campaign edits and measurement changes on the same timeline, rank competing explanations, and finish with the smallest test that could disprove the leading hypothesis.
Do not respond to an account-wide decline by changing every channel. A shared decline can come from demand, seasonality, site failure, consent, pricing, inventory, CRM logic, or a reporting definition. A single-channel decline can come from that platform’s delivery, audience, bidding, creative, placement, or conversion setup. The first broken stage constrains which explanations remain possible.
Diagnostic rule
A nearby campaign edit is a timing clue, not proof of cause. If multiple material changes overlap, the correct conclusion may be unresolved until a cleaner comparison or controlled test separates them.
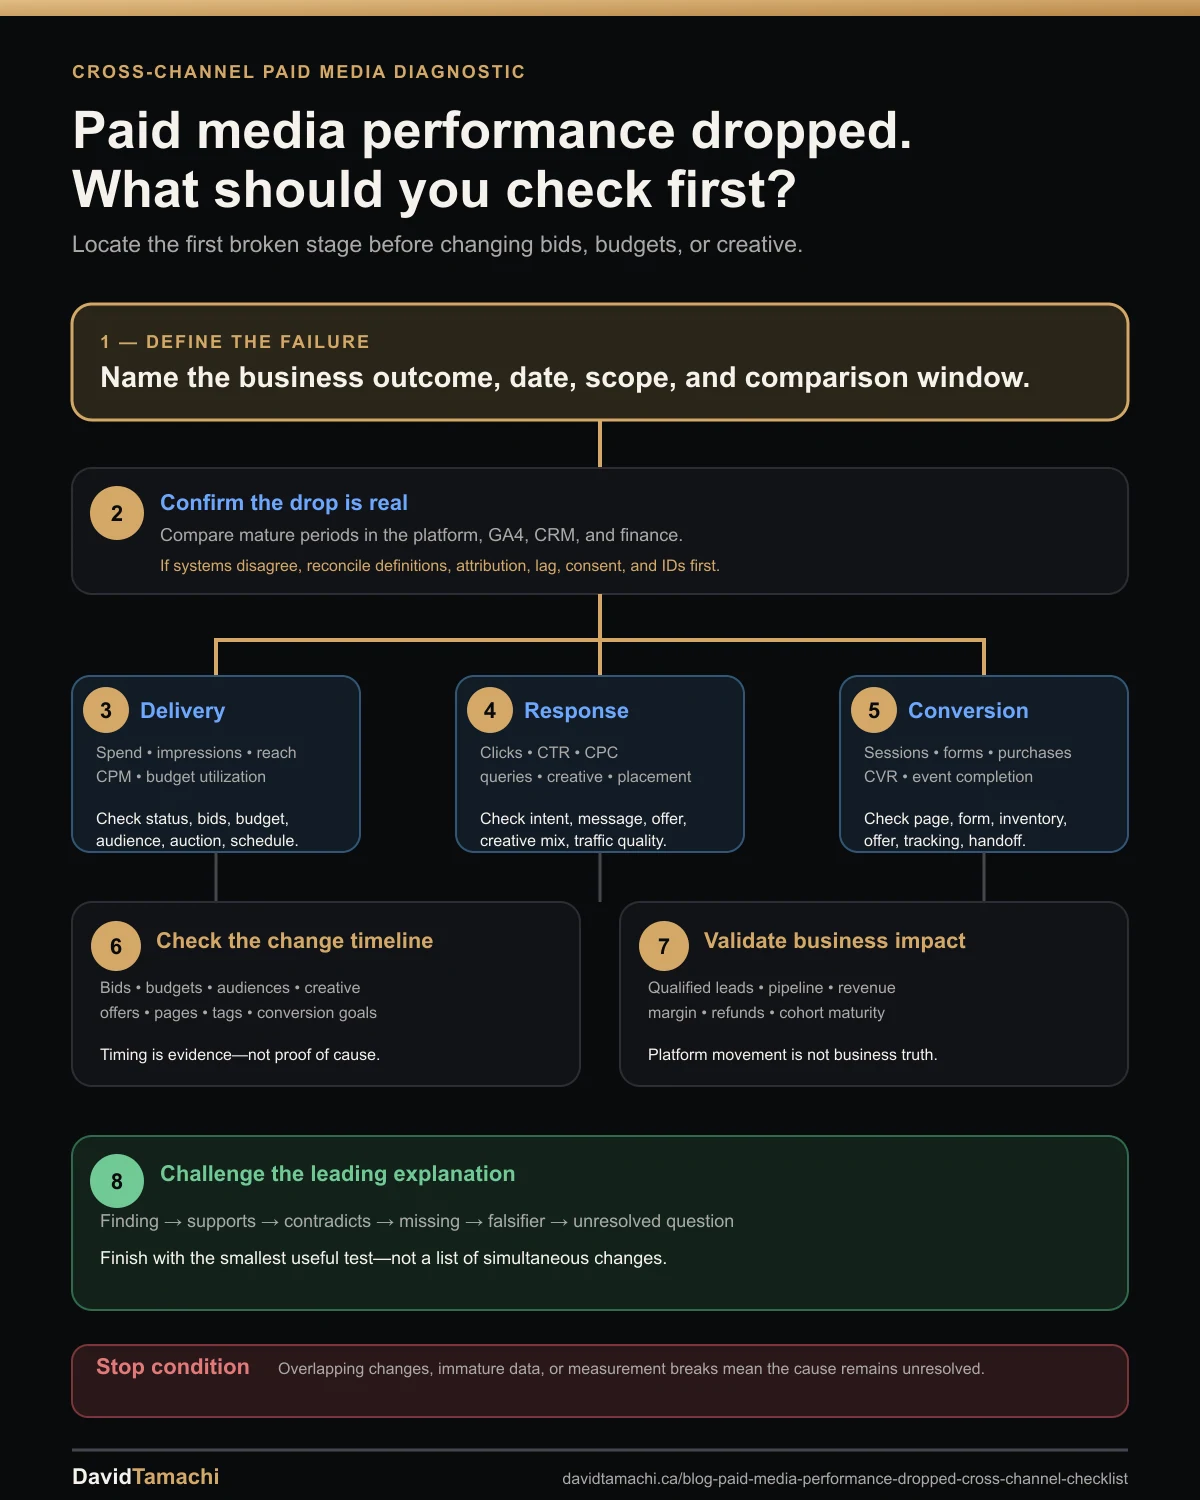
The Eight-Step Cross-Channel Checklist
| Step | Question | Evidence |
|---|---|---|
| 1. Define | What business outcome changed, when, and where? | Qualified leads, purchases, revenue, contribution profit, date, scope |
| 2. Confirm | Is the decline real and mature enough to interpret? | Platform, GA4, CRM, finance, lag, equal comparison windows |
| 3. Delivery | Did the campaign lose access to traffic or budget? | Spend, impressions, reach, CPM, budget utilization, serving status |
| 4. Response | Did the same delivery create less interest? | Clicks, CTR, CPC, queries, creative, placements, audience segments |
| 5. Conversion | Did the break occur after the click or form open? | Sessions, form steps, purchases, CVR, site performance, event firing |
| 6. Timeline | Which material changes overlap the first broken metric? | Bids, budgets, audiences, creative, offers, pages, tags, goals |
| 7. Business impact | Did the movement reach qualified outcomes or profit? | CRM stages, pipeline, revenue, refunds, margin, cohort maturity |
| 8. Challenge | What would make the leading explanation wrong? | Contradictions, missing evidence, falsifier, unresolved question, test |
1. Define the failure before opening the platforms
Write one sentence that identifies the actual decision problem. “Performance is down” is too vague. A useful statement sounds like: “CRM-qualified leads from paid media fell 22% beginning July 14 while total spend remained stable.” Record the conversion definition, channel scope, geography, product or service, campaign objective, and the unit that matters. Separate lead volume from qualified lead volume, revenue from attributed conversion value, and platform ROAS from contribution profit.
2. Confirm the decline is real and the data is mature
Compare equal-length periods with the same weekdays and similar commercial conditions. Exclude incomplete recent conversion days when lag matters. GA4 says data processing can take 24 to 48 hours and that reports can change during processing; LinkedIn says CSV conversions usually take 24 to 48 hours and can sometimes take up to one week. A recent decline may therefore be an immature cohort rather than a campaign failure.
Check whether platform, GA4, CRM, and finance move in the same direction. If platform conversions fall while CRM intake holds, investigate attribution, collection, imports, consent, and event definitions before changing media. Use the platform, GA4, and CRM reconciliation workflow when systems disagree.
3. Locate delivery problems first
Compare spend, impressions, reach, CPM, budget utilization, and serving status. If spend and impressions fall together, inspect approvals, schedules, budgets, bid targets, audience size, eligibility, billing, product feeds, and conversion-goal health. Google Ads campaign diagnostics checks serving health and configuration areas such as bidding, budget, audiences, goals, business data, products, and signals. Meta exposes campaign, ad set, and ad delivery statuses, while LinkedIn delivery should be read alongside budget, bids, audience constraints, and campaign status.
If impressions hold, the cause is later in the funnel. A landing page cannot cause impressions to fall, and creative fatigue should not be the first explanation for an account that stopped serving.
4. Check whether response weakened
When delivery is stable, compare clicks, CTR, CPC, search terms or query themes, placements, devices, geographies, audiences, and creative-level delivery. A falling CTR can reflect weaker creative, weaker message-to-market fit, a broader audience, different placements, lower-intent queries, or a competitor and offer shift. It does not identify one cause by itself.
Channel context matters. Google search performance can move with queries, match behaviour, bidding, and auction competition. Meta response should be evaluated with frequency, reach, CPM, CTR, and creative concentration rather than one frequency threshold. LinkedIn often has smaller samples, so creative and audience conclusions need enough delivery to be interpretable.
5. Trace the conversion path after the click
If clicks hold but conversions fall, inspect landing-page sessions, redirects, load time, inventory, offer terms, pricing, form opens, field-level completion, checkout steps, error logs, and conversion event firing. Compare by device and landing page. A stable click response with a weaker conversion rate points away from a pure media-delivery explanation.
Run a controlled test conversion and follow the event through the browser or server request, GA4, the ad platform, and CRM. Preserve click IDs, event IDs, submission IDs, timestamps, and CRM record IDs where privacy rules allow. Aggregate totals show the size of a break; joinable records show where it begins.
6. Put every material change on one timeline
Export or document changes to bids, budgets, targets, audiences, exclusions, placements, creative, offers, pages, tags, consent, conversion actions, CRM workflows, prices, inventory, and promotions. Meta Ads Manager activity history, for example, records campaign, ad set, ad, audience, bid, budget, run-status, schedule, and targeting changes.
A possible cause must occur early enough to explain the movement and must be capable of affecting the first broken metric. When five changes begin together, do not award causality to the most memorable edit. State the collision and design a test or segmentation that separates it.
7. Validate qualified outcomes, revenue, and profit
Platform outcomes are not the final decision layer. Join raw leads to accepted leads, qualified leads, opportunities, pipeline, revenue, and margin. Join purchases to discounts, returns, refunds, fulfilment, fees, COGS, and contribution profit. Allow cohorts enough time to mature before comparing pipeline or revenue.
If platform results improve while contribution profit falls, use the Break-Even ROAS and Profit Margin Calculator. If the question is whether the reported revenue would have happened without advertising, move from attribution to an experiment or the incremental ROAS framework.
8. Challenge the leading explanation and choose one test
Write the finding, supporting evidence, contradictory evidence, missing evidence, falsifier, unresolved question, and recommended test. Then check the runner-up explanation. A good next step changes one important condition or creates a cleaner comparison while protecting measurement and business risk.
Avoid bundles such as changing the bid strategy, budget, audience, creative, offer, and landing page together. Even if performance recovers, the account will not know which change mattered. Use the Campaign Forensics Lab to rank competing explanations and generate a decision brief with confidence limits.
How the Checks Differ by Platform
| Platform | High-value checks | Common diagnostic trap |
|---|---|---|
| Google Ads | Serving diagnostics, search terms, match behaviour, bidding targets, budgets, auction pressure, conversion goals, feeds | Calling a bid-strategy edit the cause without separating conversion lag, target constraints, and query mix |
| Meta Ads | Delivery status, activity history, reach, frequency, CPM, CTR, creative concentration, learning, data quality | Calling high frequency creative fatigue without weaker response and a meaningful replacement test |
| LinkedIn Ads | Spend, impressions, CPC, CTR, form opens, completions, conversion source, reporting lag, qualified pipeline | Calling the audience bad when the first break is form completion, tracking, or CRM qualification |
| Cross-channel | Shared demand, site, pricing, inventory, consent, GA4, CRM, finance, brand and seasonality signals | Using blended averages that hide one channel rising while another falls |
Evidence to Export
- Daily platform performance: campaign and lower-level IDs, spend, impressions, reach where available, clicks, conversions, value, and the relevant efficiency metrics.
- Change history: dated campaign, audience, bidding, budget, creative, offer, landing-page, and measurement edits.
- GA4: sessions, landing pages, key events, device and channel dimensions, property time zone, and attribution settings.
- CRM: submission, lead, qualification, opportunity, pipeline, revenue, rejection, duplicate, and cohort fields.
- Finance: realized revenue, refunds, discounts, COGS, fulfilment, fees, margin, and currency.
- Experiments: treatment, control, assignment, sample, dates, outcomes, and guardrails.
Strong conclusion format
Finding: the decline begins at paid-media delivery, not site conversion. Evidence: impressions and spend fall across two campaigns while CTR and site CVR hold. Contradiction: one unaffected campaign retains normal delivery. Falsifier: lost delivery is fully explained by reporting lag or a date-scope error. Unresolved: bid-target and audience edits overlap. Action: isolate the target constraint in the affected campaigns before changing creative or the landing page.
Frequently Asked Questions
Why did paid media performance suddenly drop?
The cause depends on the first stage that changed. Check whether delivery, response, conversion, measurement, qualified outcomes, or profit moved first, then align campaign and business changes to that date.
Should I compare each paid media channel separately?
Yes. Use the blended view to locate portfolio movement, then diagnose Google Ads, Meta Ads, and LinkedIn Ads separately because their auctions, evidence, objectives, and reporting rules differ.
How long should I wait before diagnosing a performance drop?
Wait for the normal conversion, analytics, CRM, and sales-cycle lag for the outcome being judged. Delivery failures can be acted on quickly; revenue and pipeline conclusions may require a mature cohort.
Can a before-and-after comparison prove what caused the decline?
Usually not by itself. It can rank plausible explanations, but overlapping changes, seasonality, demand, competition, and measurement shifts weaken causal claims. A concurrent control is stronger evidence.
What if ad platforms and GA4 disagree?
Reconcile the event, counting unit, date basis, time zone, attribution scope, window, consent, identity, processing lag, and joinable identifiers before declaring a tracking problem.
What should I change first?
Change the smallest condition tied to the first broken stage and define the success metric and falsifier in advance. Avoid simultaneous changes that destroy the ability to learn.
Sources and Method
Reviewed August 5, 2026. Google describes campaign serving checks across ads, audiences, bidding and budget, goals, products, business data, and signals in its campaign diagnostics guidance, and documents campaign edits, conversion tracking, delay, targets, budget, auction dynamics, and other fluctuation causes in its performance troubleshooting guidance. Meta documents delivery status, activity history, creative diversification, data quality, and results validation in its delivery-status guidance, activity-history guidance, and Performance 5 framework. LinkedIn defines conversion metrics and CSV reporting timing in its conversion reporting documentation. GA4 documents processing behaviour in data freshness and credit, window, and time-zone settings in attribution settings. The eight-step sequence above is an original evidence framework built from these system definitions; no platform publishes this exact checklist.
Continue the Investigation
Use the Campaign Forensics Lab to organize the evidence and stress-test the leading explanation. Continue with the Meta creative-fatigue diagnostic, LinkedIn lead-drop funnel, Google Ads bid-strategy diagnostic, or the conversion reconciliation workflow when one stage needs deeper analysis.