Short Answer
When LinkedIn Ads leads drop, trace the funnel from impressions to clicks, form opens or landing-page sessions, submissions, qualified leads, opportunities, and revenue. Compare equal time windows and find the first stage with a meaningful change. Falling impressions point toward delivery, budget, bidding, or targeting. Stable impressions with fewer clicks point toward creative, message, audience fit, or placement mix. Stable clicks with fewer completed forms point toward form or landing-page friction. Stable platform leads with fewer qualified leads point downstream toward targeting, offer quality, CRM logic, or sales follow-up.
Do not force an efficiency conclusion when conversions are zero. Cost per lead is mathematically undefined at zero leads, and a small sample may be unresolved rather than disastrous. Reporting lag also matters: LinkedIn says conversions uploaded by CSV generally take 24 to 48 hours to appear and can sometimes take up to one week.
Diagnostic principle
The earliest broken stage constrains the explanation. A form cannot cause impressions to fall. A tracking outage can make reported leads disappear without changing clicks or actual CRM intake. A campaign can generate the same number of platform leads while producing fewer qualified opportunities. Follow the sequence before assigning blame.
Build a LinkedIn Lead Evidence Chain
| Funnel stage | Evidence to compare | Questions it answers |
|---|---|---|
| Delivery | Spend, impressions, reach, CPM, budget utilization | Did the campaign lose access to the audience, or simply spend less? |
| Response | Clicks, CTR, CPC, creative and audience breakdowns | Did the same delivery create less interest or become more expensive? |
| Conversion step | Lead-form opens, completions, completion rate, sessions, site CVR | Did friction appear after the click or form open? |
| Attribution | Click and view conversions, conversion window, source, reporting lag | Did measurement change or have recent conversions not arrived yet? |
| Lead quality | Accepted, qualified, rejected, duplicate, and contactable leads | Did volume remain while sales-ready demand declined? |
| Pipeline | Opportunities, value, win rate, revenue, sales-cycle lag | Did the decline reach the commercial outcome? |
A Six-Step LinkedIn Lead-Drop Diagnostic
1. Scope the decline and the comparison
Write down the date the decline appears, the business outcome that matters, and every known change around it. Compare equal windows with the same weekdays and account for sales and attribution lag. Separate campaign, audience, creative, placement, device, geography, and conversion source where volume allows. A blended account average can hide one campaign collapsing while another grows.
2. Start with delivery and auction economics
Compare spend, impressions, and CPM first. If both spend and impressions fell, ask whether the campaign hit a budget, schedule, bid, pacing, approval, audience-size, or targeting constraint. If spend held but impressions fell and CPM rose, access to inventory became more expensive. If impressions held, the cause lies later in the funnel. This ordering prevents a creative or form diagnosis from being attached to a delivery failure.
3. Test the click-response layer
Compare clicks, CTR, and CPC by creative and audience. Stable impressions with lower CTR means the available audience responded less often. Creative fatigue, weaker message-market fit, audience mix, or placement changes are plausible. Review what actually received delivery; a campaign with many ads may still depend on one concept. If CTR is stable but CPC rises, CPM is probably doing more of the work.
4. Inspect the form or website conversion step
For native Lead Gen Forms, compare form opens, submissions, completion rate, and cost per lead. LinkedIn notes that clicks before submission can count as both an ad click and a lead-form open, so map the columns carefully. Review whether the form gained fields, changed required questions, introduced confusing copy, or stopped matching the ad promise. For website conversion campaigns, compare landing-page sessions, load and error behaviour, form starts, submissions, and the selected conversion event.
5. Challenge the measurement explanation
Confirm the same conversion definition, data source, attribution window, and reporting status are used across both periods. LinkedIn supports website and offline conversion inputs including the Insight Tag, Conversions API, CRM partners, and CSV uploads. Check whether tags, consent, thank-you URLs, event rules, CRM mappings, or upload schedules changed. Separate click-through and view-through conversions if the decision depends on that distinction. Recent CSV conversions may not be complete yet.
6. Join qualified leads and pipeline
Platform lead volume is not the final result for most B2B programs. Join LinkedIn campaign and creative evidence to the CRM. Compare contact rate, accepted leads, qualified leads, opportunities, pipeline value, and revenue using consistent cohort rules. LinkedIn distinguishes a lead from a qualified lead in its conversion event types; mirror that distinction in your diagnosis. Account for duplicates and deduplication logic so the same outcome is not counted through multiple sources.
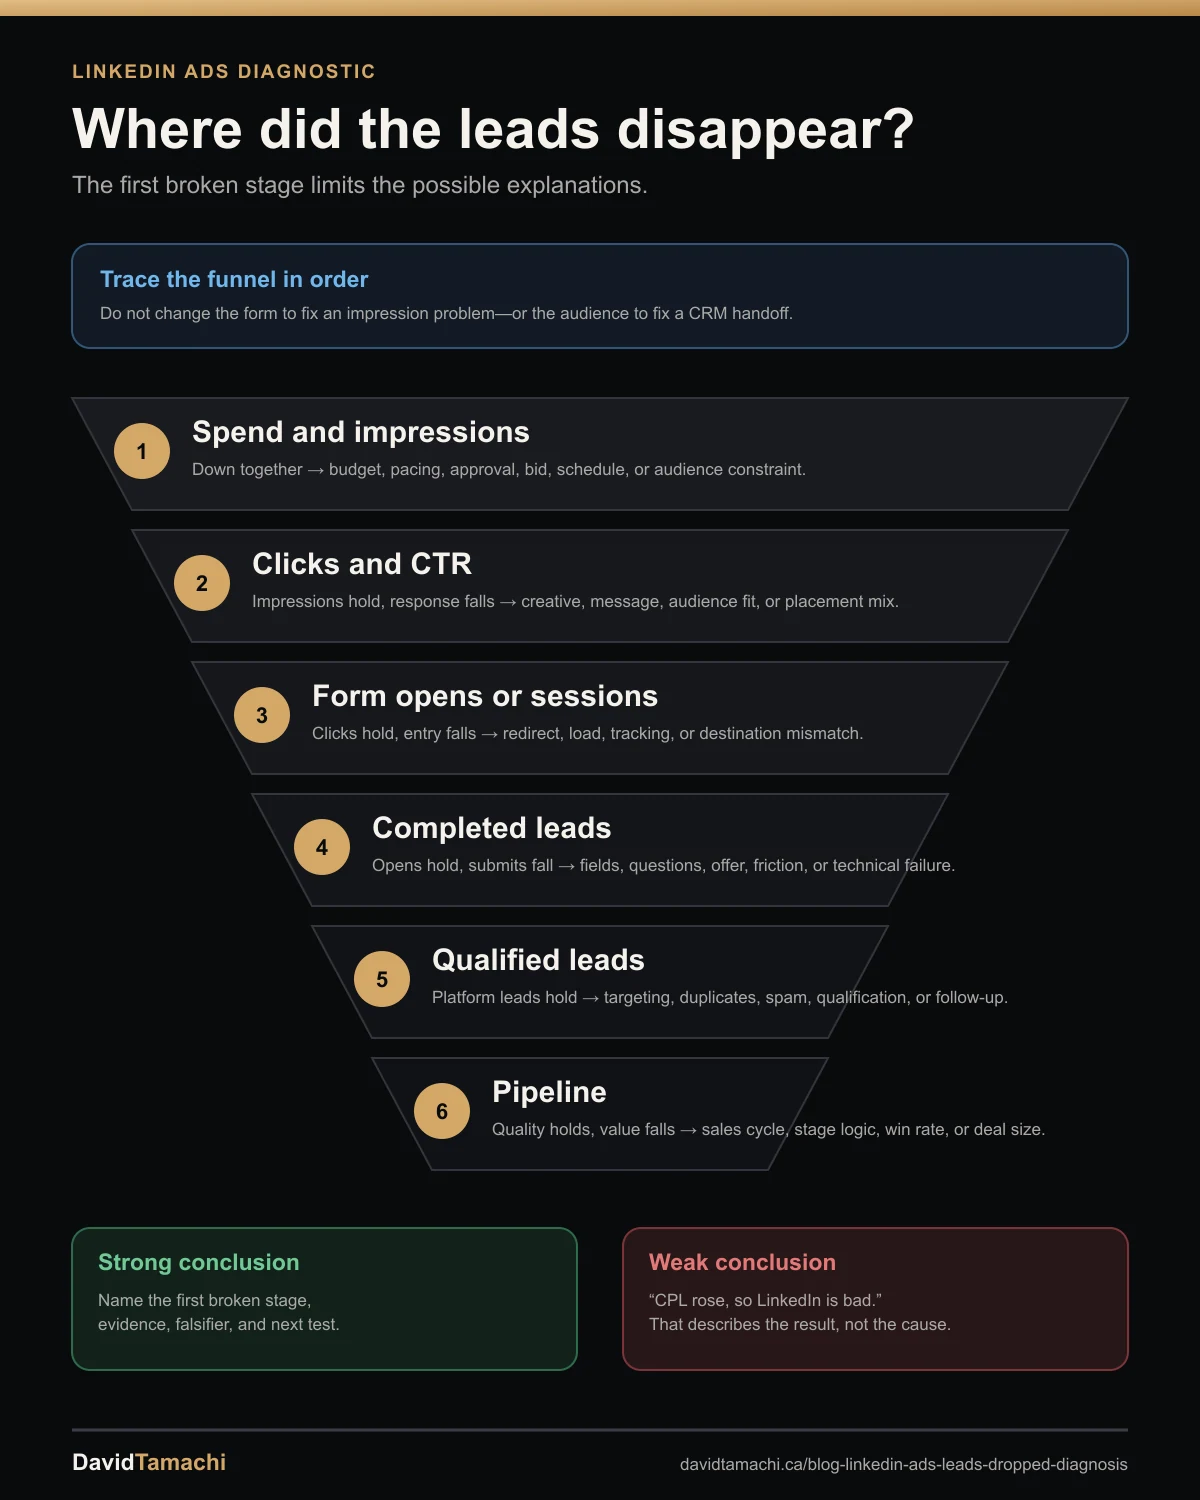
How to Interpret the Pattern
| Observed pattern | More plausible explanation | Next check |
|---|---|---|
| Spend and impressions fall together. | Budget, pacing, approval, bid, schedule, or audience delivery constraint. | Check change history and delivery status before changing the form. |
| Impressions hold, but clicks and CTR fall. | Creative, message, audience response, or placement mix weakened. | Break down by creative and audience; test a distinct message. |
| Clicks hold, but form completions or website conversions fall. | Form friction, landing-page friction, offer mismatch, or tracking. | Compare opens, starts, completion rate, site events, and recent form changes. |
| Campaign Manager leads fall, but CRM intake holds. | Attribution, integration, reporting lag, or deduplication issue. | Audit the conversion source, window, upload status, and identifiers. |
| Platform leads hold, but qualified leads and pipeline fall. | Audience quality, offer quality, qualification, or sales follow-up changed. | Inspect cohort-level CRM stages and rejection reasons. |
| Conversions are zero in a small or recent sample. | The result may be unresolved. | Check lag and tracking, then wait for enough evidence before judging efficiency. |
What Changed Near the Decline?
A useful change log is as important as the performance export. Record adjustments to audience attributes, exclusions, expansion settings, bids, budgets, objective, optimization event, creative, offer, Lead Gen Form fields, landing pages, consent, Insight Tag rules, Conversions API, CRM mappings, offline upload cadence, and sales qualification. Note external events such as holidays, category demand shifts, or a webinar deadline.
Place those changes on the same timeline as the first broken metric. A cause must be able to affect the metric and must occur early enough to explain it. When several material changes overlap, state that attribution is unresolved and design a test that separates them.
What to Export for the Investigation
Start with daily campaign and creative rows containing date, campaign, campaign group, creative, spend, impressions, clicks, CTR, CPC, CPM, conversions, conversion value, and stable IDs. For Lead Gen Forms, add form opens, submissions, completion rate, and form identifiers where available. Preserve the selected conversion and attribution settings.
Add website analytics for sessions and on-site steps; CRM data for lead status, qualification, duplicates, rejection reason, opportunity, pipeline, and revenue; and a change log. Use cohort dates consistently. If pipeline matures over weeks or months, do not compare a fully matured historical cohort with an incomplete recent cohort.
The Campaign Forensics Lab can organize campaign, analytics, CRM, finance, and experiment files into one evidence index. Select LinkedIn as the channel scope, attach the change timeline, challenge the leading assumption, and generate a brief with unresolved questions and confidence limits. Analysis runs in the browser.
Strong conclusion format
Finding: the lead decline begins at form completion. Evidence: impressions and clicks are stable, but completion rate falls after two required fields were added. Falsifier: completion fails to recover after the prior form is restored under comparable traffic. Unresolved: recent offline conversions are still within the reporting-lag window. Action: restore or test the form, then validate qualified pipeline after maturation.
Common Diagnostic Mistakes
- Starting with CPL: CPL reports the outcome, not the stage that caused it.
- Inventing a CPL when leads are zero: the value is undefined, and the evidence may still be insufficient.
- Mixing native form and website conversions: each path has different steps, friction, and tracking risks.
- Ignoring attribution and upload lag: an incomplete recent window can look like sudden deterioration.
- Treating every form fill as equal: qualification, opportunity value, and revenue may tell a different story.
- Changing the audience, creative, form, and bid together: performance may move, but causal learning is lost.
FAQ
Why did my LinkedIn Ads leads suddenly drop?
The cause depends on the first funnel stage that changed. Check delivery, click response, form or website completion, attribution and reporting, then qualified pipeline in that order.
What should I check after LinkedIn ad clicks?
For Lead Gen Forms, compare form opens, submissions, and completion rate. For website campaigns, compare landing-page sessions, form steps, conversion rate, page performance, and the conversion event.
What does a lower LinkedIn Lead Gen Form completion rate mean?
It means fewer form openers submitted the form. Added fields, confusing questions, offer mismatch, audience mix, or a technical issue may explain the change, so compare the form and traffic before assigning a cause.
How do I calculate CPL when LinkedIn conversions are zero?
You do not calculate a finite CPL when conversions are zero because spend divided by zero is undefined. Report zero conversions, the spend and sample size, then assess tracking, reporting lag, and whether enough evidence exists.
How long can LinkedIn conversion reporting take?
LinkedIn says conversions uploaded by CSV generally take 24 to 48 hours to appear in Campaign Manager and can sometimes take up to one week. Other conversion sources and sales outcomes can have different lags.
Should I connect LinkedIn Ads data to my CRM?
Yes, when qualified leads, opportunities, or revenue determine success. CRM evidence helps distinguish a platform lead-volume problem from a lead-quality, deduplication, qualification, or sales-follow-up problem.
Sources and Method
Reviewed August 3, 2026. LinkedIn defines conversions, click and view conversions, conversion rate, cost per conversion, value, ROAS, and CSV reporting timing in its conversion reporting and metrics documentation. Its conversion setup documentation describes the Insight Tag, Conversions API, CRM partners, and CSV as data sources. LinkedIn also distinguishes Lead and Qualified Lead conversion event types and documents Lead Gen Form metrics. The diagnostic sequence and interpretations above are an evidence framework built from those definitions; LinkedIn does not publish this exact decision tree.
Continue the Investigation
Use the Campaign Forensics Lab to stress-test the leading explanation against campaign, analytics, CRM, finance, and experiment evidence. If Campaign Manager, GA4, and CRM disagree, use the conversion reconciliation guide. For broader context, review how modern ad platforms change measurement or compare the same evidence discipline in the Meta creative fatigue guide.